Understanding the True Magnitude behind the Luka/AD Trade
The recent Luka/AD trade broke the basketball world when it broke last Saturday. Let's investigate the true magnitude of the trade in a data science context.


“BREAKING: The Dallas Mavericks are trading Luka Doncic, Maxi Kleber and Markieff Morris to the Los Angeles Lakers for Anthony Davis, Max Christie and a 2029 first-round pick, sources tell ESPN. Three-team deal that includes Utah.”
Before this Shams tweet broke the NBA world, there had never been a trade involving superstars that surprised fans. Due to how trade rumors and trade requests generally worked, fans were almost always privy to any major player movement before it happened. Thus, the initial blowback and surprise of the trade led to many emotions and biases seeping into any actual trade analysis. All Mavericks fans, understandably upset about losing their franchise star, have reduced the talent of Anthony Davis to that of a scrub, and some Lakers fans shocked about losing Davis have underrated the generational talent of Doncic. Thus, with the power of data science and a nifty KNN algorithm, let’s properly contextualize and analyze this historic swap of players.
This article will be written in the style of a report, highlighting our process just as much as the final findings.
The Data Science Process:
Before we get into the actual breakdown, we want to take you through our data science process and how we developed our algorithm and visualizations for analysis.
1. Data Collection:
All of our data was sourced from Basketball Reference, specifically their advanced statistics. We filtered the last 15 of the last 20 NBA seasons ( 2006-07 to 2021-22) by the top 20 players in VORP (Value Over Replacement Player) and took all of those players’ advanced data to use our dataset for KNN. After getting the top 20 players for those 15 years we downloaded each player's stats as CSV files. Then we collected stats for all of Luka’s and AD’s seasons.
2. Data Cleaning:
We merged all of the seasons’ data we collected using Python Pandas to develop one usable data frame. Then we removed unnecessary columns and rows, such as the statistical total rows for Luka and AD. We also reformatted the “season” column from “2006-2007” to “2007” for easier analysis and future visualizations.
3. Feature Engineering and Data Pre-Processing:
We identified common columns between the Luka/AD data frame and the all_players data frame (the data frame featuring the top 20 players) for feature engineering. We then removed every column outside of the numeric columns to ensure compatibility with the clustering algorithm. Then we used Sk-Learn to standardize each feature (e.g., “games played” vs. “FT%”) to ensure equal weighting.
4. KNN Model:
For our machine learning model, we applied the KNN algorithm to find player seasons most similar to Luka and AD. After we found the 20 most similar seasons to Luka and AD, we saved the names and seasons of comparable players to a dictionary. Using the dictionary, we checked how many players similar to Luka and AD appeared in the top 20 players the following season. If a player didn’t appear, it suggested a decline in performance, which could hint at how Luka/AD might perform on their new teams.
5. Visualizations:
We used Seaborn and MatPlotLib to create visualizations such as bar charts, box plots, and KDE (Kernel Density Estimate) plots. These visualizations helped us visualize which player is “better” based on their stats.
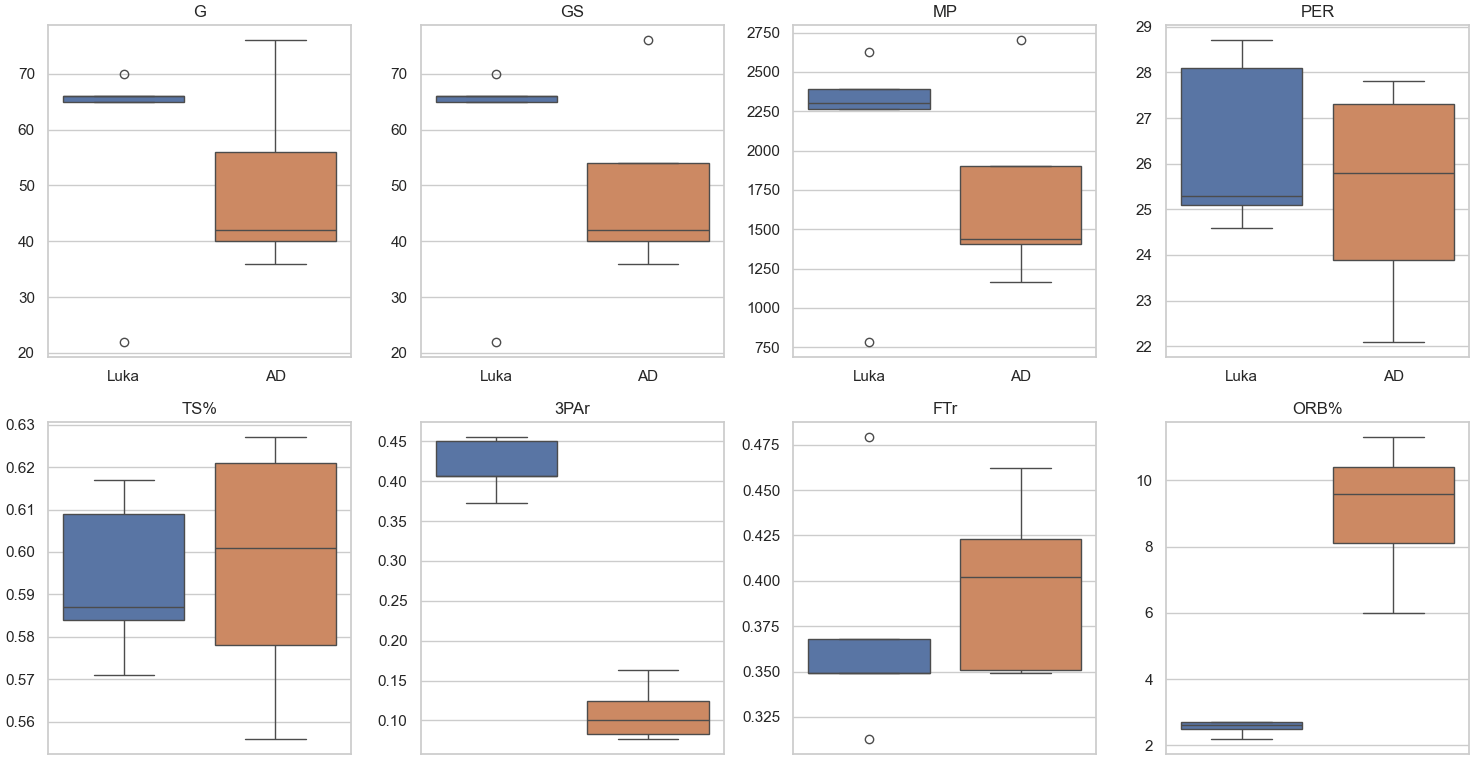
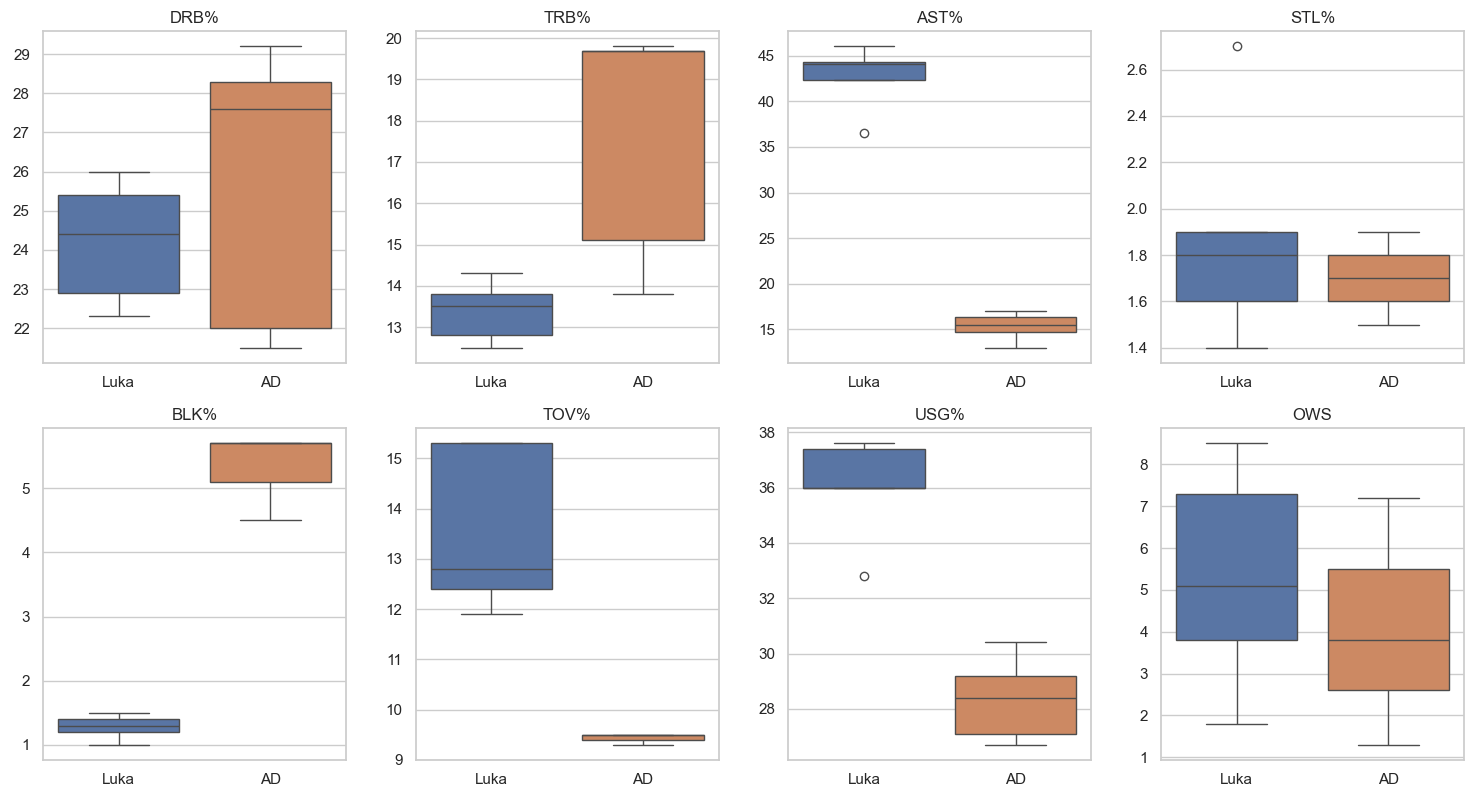
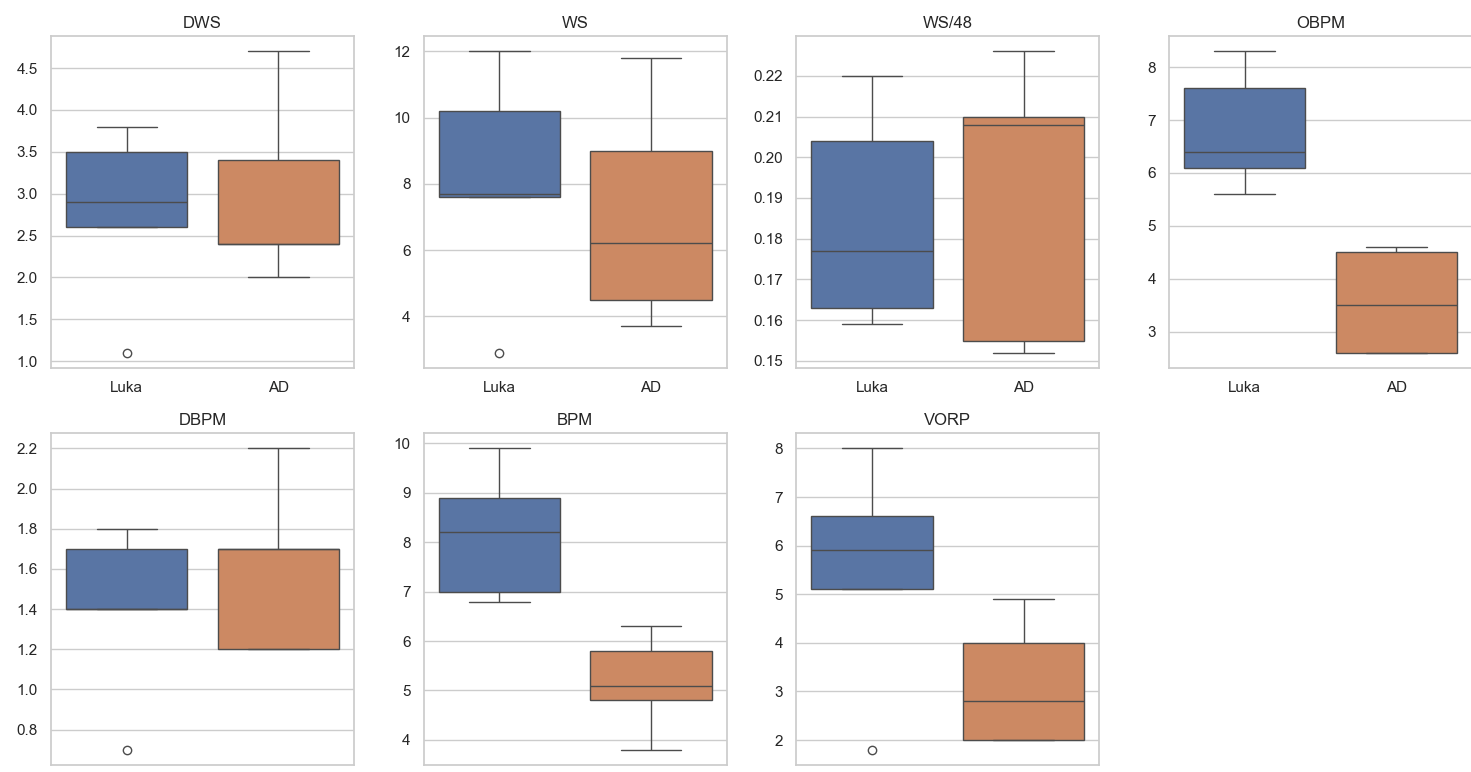
Box Plots:
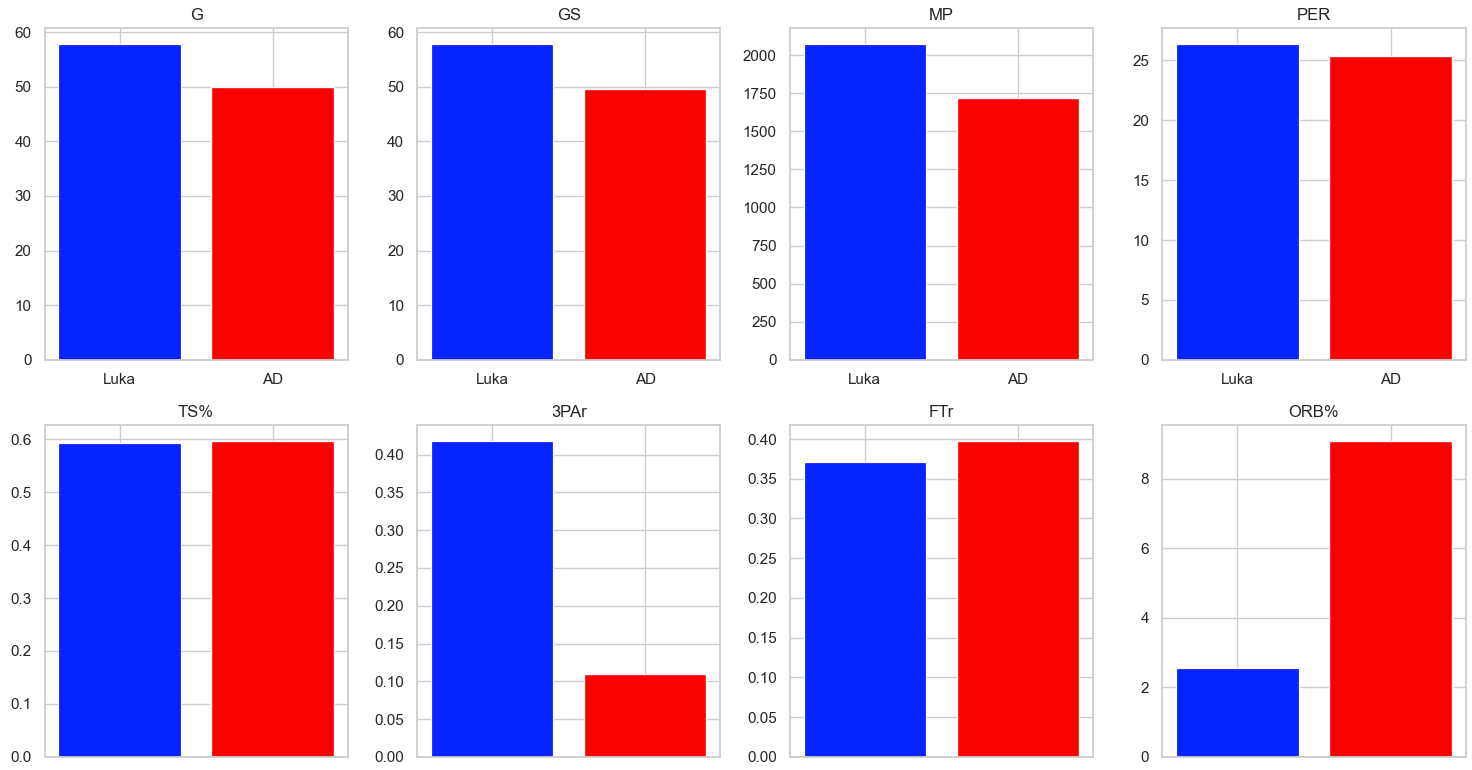
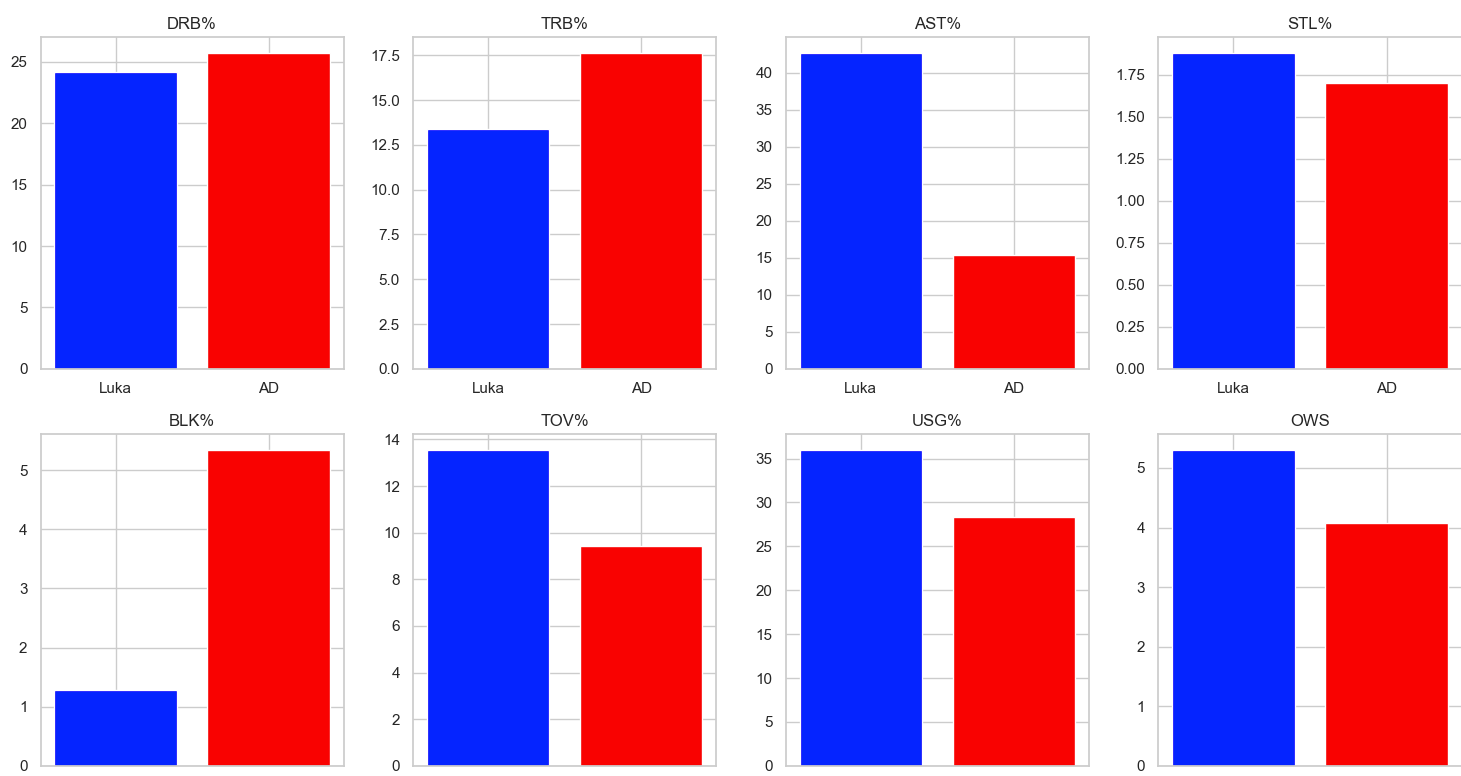
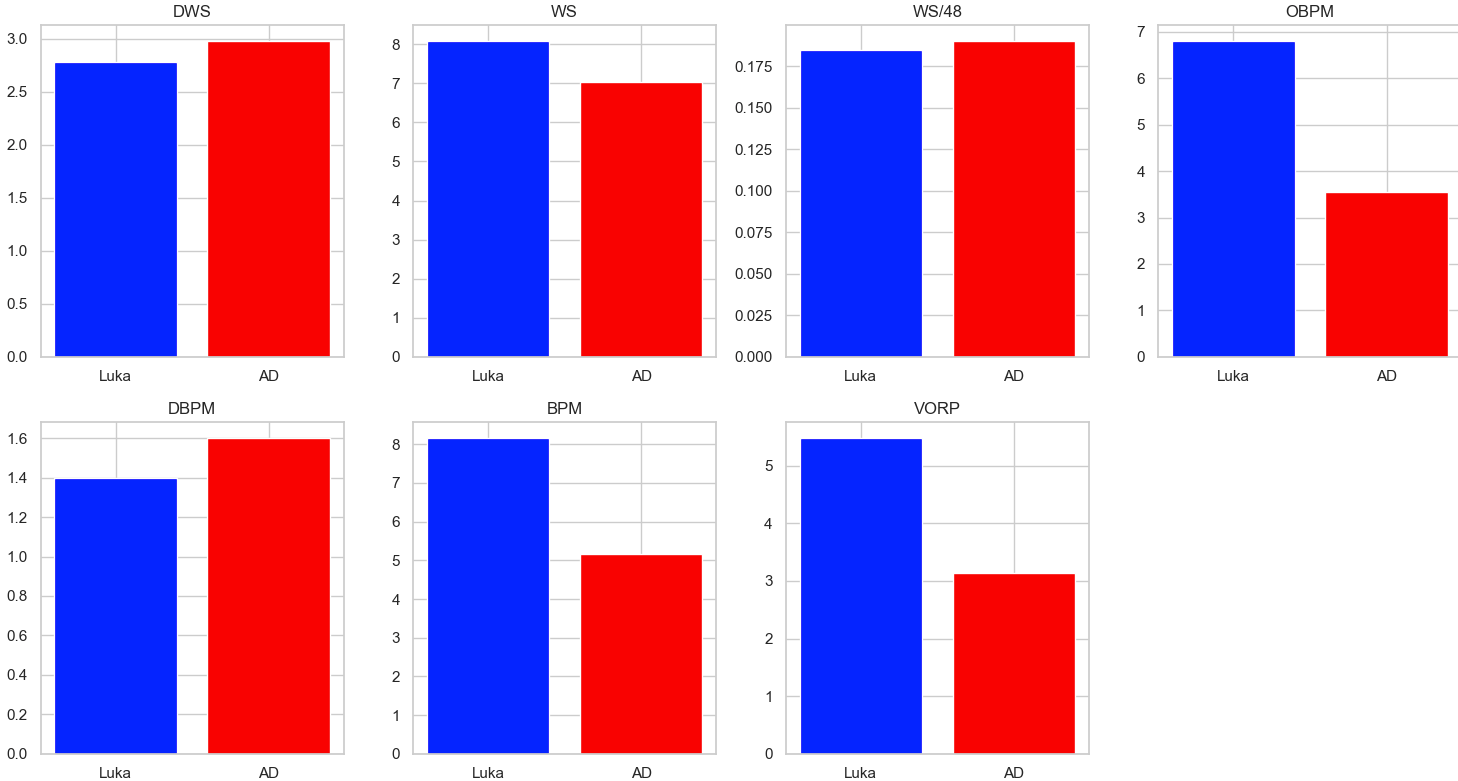
Bar Charts:
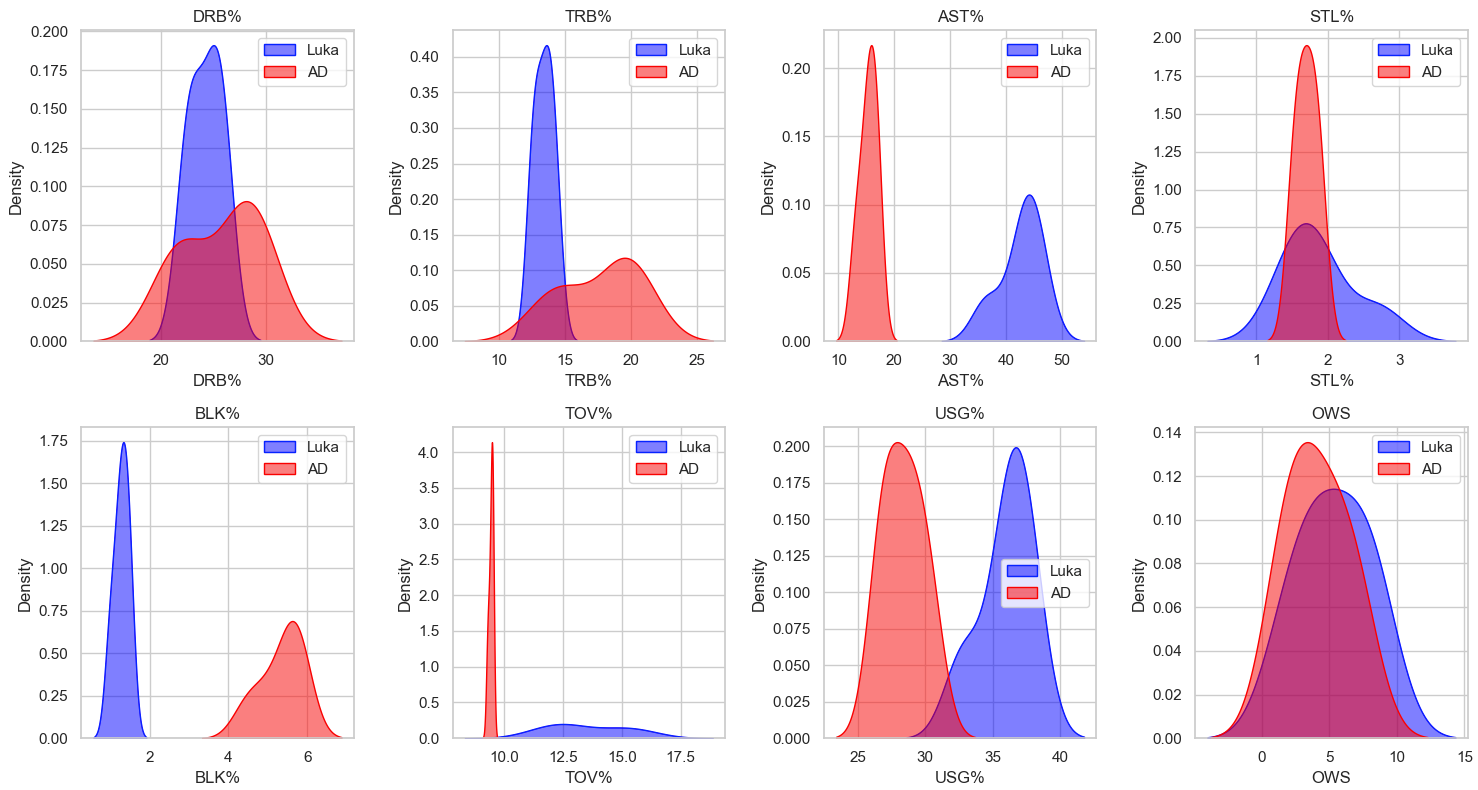
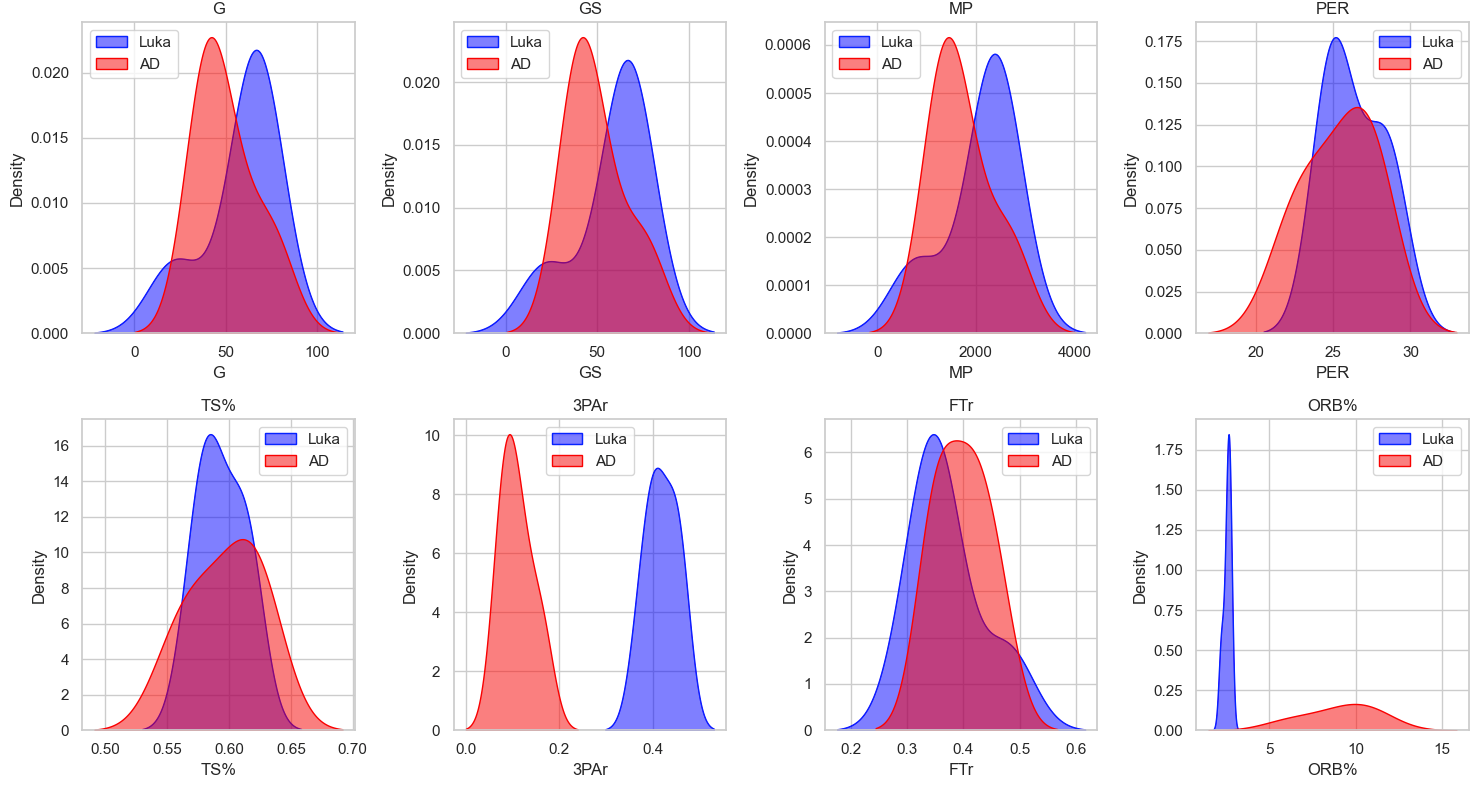
Kernel Density Estimate (KDE):
Challenges:
1. How do we choose what player seasons to include in our all_players.csv file?
One of the main challenges we faced was determining which player seasons to include in our all_players.csv file. Due to space constraints, we couldn’t include all player seasons from the past 100 years. Therefore, we limited the data to 15 of the last 20 seasons, as the game mostly evolved during this period. Additionally, we focused on the top 20 players in VORP to capture the most impactful performances.
2. Why are Lebron and KD so good?
An interesting finding emerged during our KNN analysis—approximately 90% of the players identified as similar to Luka Dončić and Anthony Davis were either Kevin Durant or LeBron James. Their dominance in the dataset skewed our results, making it difficult to draw meaningful insights. To mitigate this, we filtered out KD and LeBron from the dataset for a more balanced comparison.
3. Messy Data Hurdle
Another major hurdle was dealing with messy data, a common issue in real-world datasets that require significant cleaning. To manage this, we delegated cleaning tasks effectively among team members, ensuring the data was structured and usable for further analysis.
4. Star Players don’t get traded
Our initial plan was to analyze trades involving players similar to Luka and AD, but we encountered a challenge: star players rarely get traded. Since this limited our ability to conduct any meaningful analysis, we pivoted our approach. Instead of focusing on trades, we examined how similar players’ performance changed from season to season, giving us valuable comparisons on player development and consistency. This challenge also acted as a finding in its way. The Luka and AD trade is standalone in its surprise factor and the star power of the players being swapped. Star players of this magnitude don’t ever get traded and the Luka/AD trade is a complete anomaly in all facets.
Findings:
1. Future Performance Prediction
Based on historical similar players, both Luka and AD have around a 60% chance of remaining top 20 players in the league the following year. However, there are some limitations to this number. We only analyzed one year ahead, so AD’s performance in the next few years remains uncertain, given his age and injury history. We also didn’t fully account for how they would integrate into new team systems, meaning AD playing at the 4 could unlock new heights for his production, or Luka playing with 2 other high-level playmakers could also give new insights.
2. Current Statistical Comparison
Luka’s advanced statistical metrics are, for the most part, better than AD’s. Luka is much more consistent, as seen by the lack of variance in games played, more consistently high VORP and WS ratings, and overall better statistics in impact and counting stats. The box plots were especially telling where in all of the impact stats Luka rated higher and his plot had much less variance than AD’s signifying Luka’s consistency year by year. While the statistics and visualizations show the dominance of Luka, we must acknowledge stats aren’t everything, and on-court fit will be a big component in evaluating the trade moving forward
 | A guest post by
|
 | A guest post by
|